"Act so as to keep the mind clear, its judgment trustworthy" - Dickson G. Watts, author of Speculation As A Fine Art And Thoughts On Life. [A brief summary here (link)]

Saturday, August 28, 2010

Inflation Expectations Bet


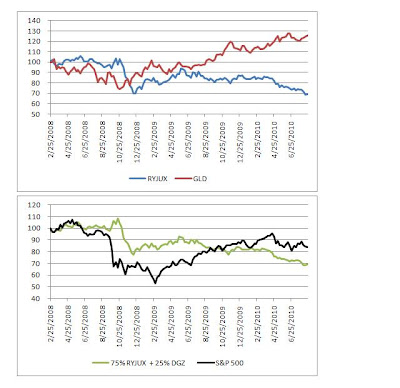
I was thinking about the disconnect between gold prices and government bond prices as they pertain to inflation expectations. Gold prices are high presumably due to expectations of increased inflation. However, government bond prices are high (i.e. interest rates are low) presumably due to expectations of low inflation if not outright deflation. The first chart above illustrates this disconnect as represented by the ETF that tracks the inverse of the 30-year Treasury bond (ticker: RYJUX) and the ETF that tracks gold prices (ticker: GLD). As you can see, the spread between the two is relatively wide now. In the simplest terms, if I want to try profiting from this disconnect, I might consider (i) buying the ETF that moves inversely to the price of gold (ticker: DGZ) and (ii) buying RYJUX.

Such a combination would reflect my personal expectation that inflation reality will play out somewhere in between the two aforementioned sets of expectations. Helicopter Ben Bernanke will neuter deflation by increasing the base money supply via quantitative easing, thereby sufficiently offsetting the decline in credit / velocity of money. The resulting increased inflation (or lack of deflation) will raise nominal interest rates, thereby decreasing bond prices and increasing the price of RYJUX. However, since inflation probably will not get out of hand and I think this outlook will eventually become widespread, it will cause the price of gold to decline, thereby increasing the price of DGZ. If I'm wrong and inflation gets out of hand, then losses from DGZ should be more than offset by gains from RYJUX.

So there are three scenarios:
1. If there is moderate inflation (my expectation), then this trading setup should do well.
2. If there is hyperinflation, this trading setup should do just OK.
3. If there is deflation, this setup is most likely a looser.

I might consider solely buying RYJUX, but then it's possible that increased inflation expectations could be offset by lower real interest rates, thus leaving nominal interest rates unchanged, thus leaving the price of RYJUX unchanged. Meanwhile I would miss out on the likely rise in DGZ resulting from the moderate (not hyper) inflation.

UPDATE: The fly in the ointment here could be the method of quantitative easing. For instance, if the Fed keeps the treasury bond prices artificially high by purchasing them with newly created money, then you could in fact end up with the counterintuitive scenario of continued low interest rates on treasury bonds and high inflation, in which case the trade outlined above would be a bust until the quantitative easing abates. In other words, the Fed could seriously distort the connections between market expectations of inflation and treasury interest rates. However, the Fed could implement quantitative easing by purchasing financial assets other than treasuries, such as mortgage bonds, in which case the trade would likely work out well.

Technical notes:
1. The charts only go back to the start of 2008 because that's when the DGZ ETF was originated.
2. The allocations between RYJUX and DGZ are 75% and 25%, respectively, because DGZ is more volatile and those proportions help minimize the overall volatility of the setup.
3. To be precise, 30-year government bond prices may be high primarily due to technical factors such as 'flight to safety', rather than expectations of low inflation or deflation and the associated low short-term interest rates during the foreseeable future, but the distinction shouldn't impact the above analysis.

Quote for the Week: "Envy reflects our values by showing us not just what we want, but also what we would do to get what we want...because we're envious only of people who make their money in ways that we condone. We envy people for getting what we want in ways we can imagine. The more distant the possibility of achieving a certain kind of success, the weaker the envy. How can you control your envy? The same way you control all your emotions: by changing your beliefs. Convince yourself...that your life will not be essentially improved by a new patio, and you'll no longer envy your neighbor's new addition to his house. When you change your values, you change your emotions...success depends in part on understanding how our evaluations direct our emotions. To gain that understanding, we need to do a bit of philosophical analysis. -Joshua Halberstam, author of Everyday Ethics, copyright 1993.

Saturday, August 21, 2010

model portfolio backtest


One of the cool things about folioinvesting.com is the ability to quickly see a backtest of how your current portfolio would have done in the past versus a benchmark. As shown in the chart above, our model portfolio with roughly 2/3 invested in low beta stocks and 1/3 invested in the short-S&P 500 ETF (ticker: SH) would have done pretty well over the past 4 years as compared to being 100% long the S&P 500.

Note: the time period selected (i.e. 4 years) was chosen solely because the short-S&P ETF wasn't originated until 6/2006.

real estate (part 3)


So what happens if I just select the 10 cities with the lowest volatilities and allocate 10% to each one without any regard to the correlations amongst the cities?

Answer: since the volatilities are less ephemeral than the correlations, this is a good solution. Maybe not perfect and I know there are more sophisticated methods available, but for someone like me with limited mathematical abilities this is a good practical alternative. As shown in the chart above, the cities with the lowest volatilities in the first 10 years tend to maintain these characteristics during the subsequent out-of-sample test.

For the sake of comparison, the average volatility of the 10 selected cities during the first 10 years was 2.8%, which is lower than the average volatility of the 25 cities of 4.2% during that period. During the subsequent out-of-sample test, the realized volatility of the 10 selected cities remained only 2.8% while the volatility of the 25-city portfolio actually increased to 4.6%.

Take-away: to minimize volatility, just allocate amongst the least volatile constituents.

Big Take-away: Be sure to conduct an out-of-sample test, so you don't get fooled by randomness when trying to answer a question based on historical data.

Quote for the Week: "The return of your investment is never the direct payoff of any one thing, but from the self-knowledge and connections gained by getting one's hands dirty. Much of success is dreaming about finding gold, and then discovering you can get rich selling shovels to gold miners. There are many examples of businesses founded on unique business selling points that, with hindsight, were wrong. This is the one thing ignorant but ambitious young people have that their more knowledgeable and older colleagues are envious of. Young people have the time an energy to discover [what] older people do not, but this assumes one actually invests this time and energy doing things, and does not just talk about them. In searching for alpha, you often have dreams that are often ill-founded, but they can actually be beneficial, because they offset the general under-appreciation of the option value of trying things and then learning an incidental skill that introduces you to new opportunities." -Eric Falkenstein, author of Finding Alpha

real estate (part 2)


So to pick up where we left off: how can one easily and reliably minimize volatility? The first chart above shows what happens when you weight the cities according to what would have produced the lowest volatility in the first 10 years and then watch what happens in the subsequent 10 years.

Answer: in the out-of-sample test, the formerly low volatility portfolio unexpectedly becomes even more volatile than the equal weighted portfolio.

Explanation: the portfolio weights were chosen via Excel Solver to minimize volatility during the first 10 years. This approach implicitly accounts for not only the volatility of each city, but the correlations amongst the cities. Sounds great, right, more is better? Not when the correlations are random. What happens, is the cities that were formerly non-correlated by chance are subsequently correlated in the out-of-sample test. Classic case of fitting the data to a theory or being fooled by randomness.

Just as aside, the weighted average volatility of the constituent cities selected by Solver was 4.4% during the first 10 years. This weighted average volatility was even higher than the 4.2% volatility of the equal weighted portfolio of cities, but nonetheless the selected portfolio exhibited an actual overall volatility of only 1.0% during the first 10 years because of how the movements of certain cities just so happened to offset the movements of other cities. When I subsequently conduct the out-of-sample test, the "just so happens" didn't happen anymore. Next I'll show a simple way to overcome the problem of persnickety correlations.

Saturday, August 14, 2010

retail sales update


Just a quick update on yesterday's release of US retail sales data. Looks like the year-over-year weakening may be stabilizing, but I think I'll wait for an outright uptick before moving the model portfolio back to a net long position. The market neutral position over the past couple months has helped widen the gap to 11% over the benchmark (Vanguard Total World Stock ETF).

real estate


Following in the wake of my friend Peter Benda's research of various housing markets around the country, I decided to download some data from the government (OFHEO) and do some simple exploration myself. As you may recall, I've been contemplative this year of the lack of connection between risk and return as shown in the book Finding Alpha. Well, I thought it may be interesting to follow that train of thought into the real estate sector where I happen to have a personal interest due to my line of work.

To that end, I took a look at whether or not there is a statistical connection between risk (as measured by volatility) and return (price appreciation) as it pertains to housing prices within the top-25 metro areas in the US. As you can see in the scatter chart above, where each dot represents a different city's position on the risk/return plane, there is no apparent connection (click each chart twice to view clearly).

I think the take away is that investors should try to minimize risk as much as possible. If the future looks anything like the past, this strategy ought to result in average returns with below-average volatility. Of course, the next logical question is how one should minimize risk. One possibility would be to allocate an equal weighting of one's investment portfolio to each market, which I think should be the null hypothesis. Another possibility would be to allocate market weights according to what would have minimized volatility within the past say 10 years, but this approach assumes that the standard deviations and correlations of and between market returns will persist into the future. Next week we'll see if this is the case.

Quote for the Week: "My third maxim was to endeavor always to conquer myself rather than fortune, and to change my desires rather than the order of the world, and in general to habituate myself in the belief that save our thoughts there is nothing completely in our power, and so to recognize, in respect of the things which are external to us, that when we have done our best, whatever is still lacking to us is, so far as we are concerned, absolutely impossible of achievement. This, it seemed to me, is sufficient to prevent me from desiring for the future anything which I knew myself incapable of having, and so to render me content. For since our will does not of itself lead us to desire anything save what our understanding exhibits as being in some fashion possible of attainment, it is evident that if we consider external goods as being all alike beyond our power, we shall no more regret the absence of goods that seem due to our station, should we through no fault of our own be deprived of them, than we do in not possessing the kingdom of China or Mexico. Making thus, so to speak, a virtue of necessity, we shall no more desire health when ill, or freedom when in prison, than we now do bodies made of a matter as little corruptible as diamonds, or to have wings to fly like birds. There is, however, I confess, need of a prolonged discipline, and of meditation frequently renewed, if we are to hold firmly to this attitude in all circumstances..." - Rene Descartes (1596-1650)

Tuesday, August 3, 2010

vacation


i've been neglecting my commitment to weekly posts because i was on vacation this past week in searsport, maine where my wife has family. couldn't have asked for better weather - sunny everyday and mid-70s temp. only drawback was i threw out my shoulder either golfing, skipping rocks, or tugging on the dogs' leashes - take your pick. was ok though b/c i didn't look at the blackberry and successfully checked out mentally from the office. fresh lobster (1.5 lb, hardshell) from young's lobster pound didn't hurt either. most important, family time was a treat.

i succeeded just prior to the trip in sparking my 15-year-old's interest in philosophy (to add to our shared interests) and we basically went wild buying a bunch of books on the subject at the various independent bookstores. everything from text books published in 1901 to modern library edition classics from the 1950s to re-interpretations published this century. what this means is i now have fresh quotes to pass along to you dear reader.

Quote for the week: "How singular a thing is pleasure and how curiously related to pain, which might be thought to be the opposite of it; for they never come to a man together, and yet he who pursues either of them is generally compelled to take the other." - Socrates, presumably speaking of my shoulder or market volatility, i'm not sure which.