"Act so as to keep the mind clear, its judgment trustworthy" - Dickson G. Watts, author of Speculation As A Fine Art And Thoughts On Life. [A brief summary here (link)]

Wednesday, June 30, 2010

model portfolio performance update


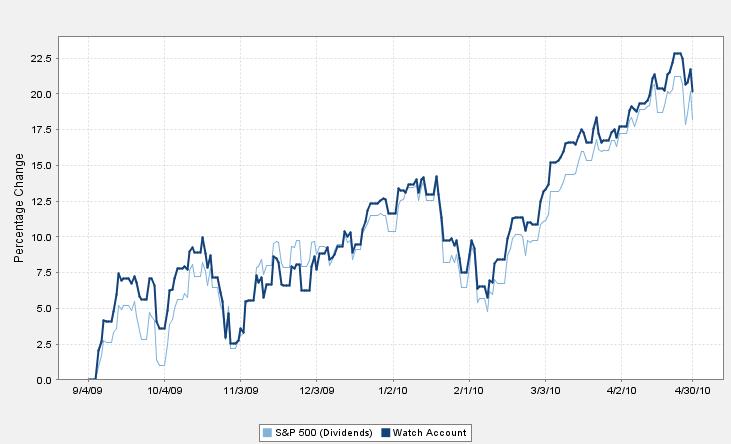
Timing of recent moves to trim the portfolio Beta down to ~0.0x was fortuitous insofar as the market moved downward almost immediately thereafter. The model is now up ~15% since inception vs. ~0% for the benchmark Vanguard Total World Stock fund (ticker: VT).

Essentially, the portfolio is now 66% long of low beta stocks diversified across economic sectors and national geographies, except for my own esoteric bias against banks and gold miners, and 33% short of the S&P 500 (i.e. Large-cap, U.S. stocks).

Since I think the economy has reached an intermediate term headwind, I don't expect to go net long again anytime this year. The market will probably have a few huge up days here and there as the Fed makes announcements concerning liquidity supports, but overall I think the downside risk is too much for being long anytime soon. I wish I saw it differently, and was correct in seeing it that way, but that's not the case and only time will tell. It's frightening to see the recent flight to treasuries and away from stocks and high-yield bonds; reminds me of darker days. At the least, it doesn't portend good things for folks seeking work. If only this were to prove true, the import-substitution effect and associated multiplier would be a huge game changer and brighten the future of profits and jobs (ht: andrew).

Saturday, June 26, 2010

Theory of Runs


A trading book I was reading a few weeks ago had a chapter on Martingales and Anti-Martingales. I already knew the pitfalls of a Martingale strategy based on an unfortunate occurrence in Vegas a few years ago when I had but 15 minutes before needing to catch a cab to catch a red eye back to home. I sat down at a $10 black jack table with a couple friends and proceeded to double my bet every time I lost hoping the ever present risk of a run of bad hands wouldn't be realized. I was $800 lighter in the pocket when I caught that cab.

Anyhow, when reading of the Anti-Martingales strategy whereby one increases their bet after a win and decreases the bet after a loss, I was reminded of the book Bringing Down the House wherein this type of strategy was used for risk management purposes. So the combination of these two experiences created a desire to back-test the strategy against historical stock market data (SURPRISE!).

Using Dow Jones Index data from yahoo! finance going back to 1929, I ran the following test:

1. If the prior day was a down day, then don't invest.
2. If the prior day was an up day, then invest 100%.
3. If the prior two days were up, then invest 200%.
4. If the prior three or more days were up, then invest 300%.

Historically speaking, this strategy would have needed to use margin (i.e. borrowed money) to purchase stocks equal to 200% or 300% of ones bankroll or 'stake'. However, today such leverage can be effectuated via ETFs such as UPRO and SDS.

The results of the test are displayed in the charts above. Some interesting take-aways:

1. The Anti-martingales strategy produced higher returns than the Buy&Hold strategy whilst its Beta (relative to the Buy&Hold strategy) typically ranged over time from 0.5x to 1.0x, thus producing a considerable amount of Alpha when measured over the entire 80 years.
2. There were a couple time periods, such as the 1930s and 2000s, when the Anti-martingales strategy would have cost someone ~90% of their stake.
3. All the outperformance of the Anti-martingales strategy came from the period 1940-1974. From 1974 to 2000ish, the returns of Anti-martingales essentially matched those of the Buy&Hold strategy.
4. Around 1974, the average 'run' of either positive or negative days in the market experienced a sudden drop from ~2.3 days down to ~1.9 days. Although I'm not sure why the average 'run' suddenly decreased then (widespread use of computers for trading?), the fact that it did obviously impacted the performance of the Anti-martingales strategy.

Conclusion: I wouldn't try this Anti-martingales strategy since it hasn't worked since 1974. However, the last time this strategy experienced a 90% decline (1930s), it really outperformed over the subsequent 35 years. Perhaps since this strategy experienced a 90% decline in the 2000s it could be poised for some outperformance.

Sunday, June 20, 2010

market timing (part 1.2)


Since I basically changed the model portfolio to be market-neutral last week based on the most recent retail and employment stats, I thought it worthwhile to update my prior post on market timing based on retail sales. Last week, I did what no trader should do, which is to take action based on quantitative data before back-testing the decision. In other words, my prior back-testing was based on a rule whereby the trailing-2-month average retail sales were compared to the trailing-12-month average retail sales. So, just to get squared away, this week I've back-tested what it would looks like if one were to have traded based on the criteria I implicitly cited last week, which was:

1. If the year-over-year retail sales growth has weakened for two consecutive months, then sell.
2. If the year-over-year retail sales growth has strengthened for two consecutive months, then buy.
3. Otherwise, hold your position (either in or out of the market as the case may be) the same as the previous month.

The results are shown in the chart above, and the story is essentially the same as it was. Lower variability of returns (standard deviation), much lower Beta, and positive Alpha, which you'll recall is simply the amount of 'excess' return after adjusting for what you 'should' have received after adjusting for the lower Beta of the market-timing strategy. As you can see, this is a long-term strategy that will under-perform in bull markets and outperform in bear markets, but over the entire cycle does fairly well after accounting for the lower volatility risk.

Note: retail sales data is only available in electronic format back to 1994.

Quote for the Week: "Anger is an acid that can do more harm to the vessel in which it is stored than to anything on which it is poured." - Mark Twain

Saturday, June 19, 2010

happy fathers day!

I attended this class back in October, the week before my second son was born, and won a door prize for being the expectant father with the nearest due date. It's a great, informative, positive program that I'd recommend to any expectant fathers you may know. I've since been back a couple times as a 'veteran' together with my son to share my own experience with the new 'recruits'. Anyhow, the program hosted a big event today in honor of fathers day and I thought I'd share a couple poinant quotes:

"Slow down and live today like you're dying. Because you are. You just don't know the rate at which you're dying or the expiration date."

Advice to your child when they stop thinking you know everything: "The older you get, the smarter I'll get".

Saturday, June 12, 2010

Quotes from Reminiscences of a Stock Operator

REMINISCENCES OF A STOCK OPERATOR by Edwin LeFevre The Sun Dial Press,Inc. Garden City, New York Copyright 1923, by George H. Doran Company

"The public ought always to keep in mind the elementals of stock trading. When a stock is going up no elaborate explanation is needed as to why it is going up. It takes continuous buying to make a stock keep on going up. As long as it does so, with only small and natural reactions from time to time, it is a pretty safe proposition to trail along with it. But if after a long steady rise a stock turns and gradually begins to go down, with only occasional small rallies, it is obvious that the line of least resistance has changed from upward to downward. Such being the case why should any one ask for explanations? There are probably very good reasons why it should go down, but these reasons are known only to a few people who either keep those reasons to themselves, or else actually tell the public that the stock is cheap. The nature of the game as it is played is such that the public should realise that the truth cannot be told by the few who know."

"Speculation in stocks will never disappear. It isn't desirable that it should. It cannot be checked by warnings as to its dangers. You cannot prevent people from guessing wrong no matter how able or how experienced they may be. Carefully laid plans will miscarry because the unexpected and even the unexpectable will happen. Disaster may come from a convulsion of nature or from the weather, from your own greed or from some man's vanity; from fear or from uncontrolled hope."

"On the other hand there is profit in studying the human factors the ease with which human beings believe what it pleases them to believe; and how they allow themselves - indeed, urge themselves -to be influenced by their cupidity or by the dollar-cost of the average man's carelessness. Fear and hope remain the same; therefore the study of the psychology of speculators is as valuable as it ever was. Weapons change, but strategy remains strategy, on the New York Stock Exchange as on the battlefield. I think the clearest summing up of the whole thing was expressed by Thomas F. Woodlock when he declared: "The principles of successful stock speculation are based on the supposition that people will continue in the future to make the mistakes that they have made in the past.""

Friday, June 11, 2010

houston, we have a problem


Yesterday, I received an email from my friend and first boss post college, to which I replied:

"i've been thinking hard lately about taking my model portfolio beta down from ~0.50 to 0.25 by allocating 10% to 2x inverse S&P. but the gubmint releases retail sales tomorrow at 8:30am, which if they come in near expected 0.4% month over month growth (seasonally adjusted), will still show a decent y/y figure (which is my personal favorite indicator). overall, i think i'd rather leave something on the table than get trigger happy - so will likely wait for more confirmation. when i think about potential future scenarios, i just don't see the S&P going back to 666 simply b/c i don't see liquidity getting squeezed like it was back then. also, i think the FED can buy a lot of treasuries to finance govt spending via seniorage without creating inflation pressures, especially if the proposed higher banking reserve ratios keep a permanent lid on lending / velocity of money."

The retail sales figures released this morning were not good. Down 1.2% (month/month), rather than the consensus estimate of up 0.4%. More importantly in my view, this marks the second month in a row where the year/year increase has weakened (see chart above - click it twice).

So what do I do? I go look at other indicators to confirm and I find that the employment sitch isn't any better. Everyone was talking last week about how something like 90% of the new jobs were due to census hiring. Furthermore, calculated risk shows that temp hiring (which tends to lead payrolls) has pulled back. As icing on the cake, the small business hiring that usually isn't picked up by government payroll stats during economic recoveries (which tends to cause people to call them 'jobless' when they really aren't) apparently isn't there.

Separately, and perhaps most ominous, the TED spread has begun to widen. This is particularly worrisome to me because of all the zombie commercial real estate loans out there for which the only sustenance is low LIBOR. This is b/c their interest expense charged to borrowers is most often a spread over LIBOR, which if it's low, can be covered by cash flow generated by the property.

I think the writing is on the wall now. No use in waiting for the trumpets to sound. Trade early or not at all. [feel free to insert your own favorite cliche here]. I'm going to offset the model portfolio's exposure to the stock market by allocating ~33% to the Proshares ETF that is short the S&P 500 (ticker: SH). That will take the beta down to ~0.0x [33%*(-1.0) + (1-33%)*0.5 = 0.0]. I chose the ETF that's 1x inverse of the S&P 500, rather than the version that's 2x inverse b/c I don't like leverage (long or short).

I stand by my views expressed in the email to my friend, but I think we now have confirmation. I don't think the S&P will return to 666, but rather will swing back and forth between 800-1,200 for a few years until P/E ratios (i.e. valuations) bottom out and we begin with a new secular bull market. In the meantime, I think it's worth trying to avoid some of the downswings. At the very least, decreased exposure now will reduce volatility in my account and thereby help preserve clear judgement.

My only hesitation is that I don't know anyone who is bullish on the market right now, but I'm just going to chalk that up to being a function of my friend selection. Nevertheless, when you're a contrarian investor at heart (it's intuitively appealing), it's always bothersome to find someone who agrees with you. I take solace from the fact that wall street sell-side shops are still ostensibly bullish. In any case, I want to make decisions based on intermediate-term drivers like economic stats, without regard to short-term drivers like sentiment. [UPDATE: I hope these guys are both representative of the market consensus and overly optimistic]

P.S. Looking to the bright side, if you choose not to reduce your exposure to stocks at this time and this downswing I've described actually plays out, it will provide a nice chance to convert regular IRA accounts over to Roth IRAs while minimizing the amount of income taxes triggered (which are based on the value of your account at the time of conversion).

Monday, May 31, 2010

happy memorial day


No post this weekend b/c I was at the beach with the fam.

Sunday, May 23, 2010

real interest rates (part 3)


Just to round out the thoughts on real interest rates, I've run a simplistic multi-variable linear regression in Excel to try isolating the effect of real interest rates on the S&P 500. The idea is to re-test the association between real interest rates and the S&P while controlling for the aforementioned effects of inflation on those real interest rates. The reason I say it's a simplistic analysis is because there is some obvious multi-collinearity involved whereby our two explanatory variables (real interest rates and inflation) are not totally independent of each other. Therefore, you can't trust the co-efficients derived by the analysis (i.e. "how much"), but I think perhaps it's at least helpful to suggest whether or not the S&P tends to go up or down when real rates increase. I'm sure there are more sophisticated statistical techniques capable of overcoming this multi-collinearity amongst the explanatory variables, but if so, they are beyond my knowledge.

As shown in the charts above, the results suggest there is in fact an inverse relationship between real interest rates and the S&P 500. The co-efficient for inflation is -5.98, meaning when inflation increases 1%, the S&P tends to decrease on average -5.98% that year. The co-efficient for real interest rates is -4.25, meaning when real interest rates increase 1%, the S&P tends to decrease on average -4.25% that year. Like I said, you can't trust the exact value of these co-efficients, but I believe at least the signs are correct, such that increasing real interest rates are associated with a decreasing S&P 500.

Considering that inflation is currently low by historical standards, one might reasonably conclude the probability of an increase in inflation is greater than the probability of a decrease. By extension, one might reasonably conclude the probability of a decrease in the S&P 500 is greater than the probability of an increase. On the other hand, since real rates are not low by historical standards, one could reasonably expect an increase in inflation to be accompanied by a decrease in real interest rates, which would counteract some of the negative influence upon the S&P.

real interest rates (part 2)


To follow-up on the post last week, I subscribed to and downloaded some data from http://www.economagic.com/, which I think is a great source of data at a very reasonable price.

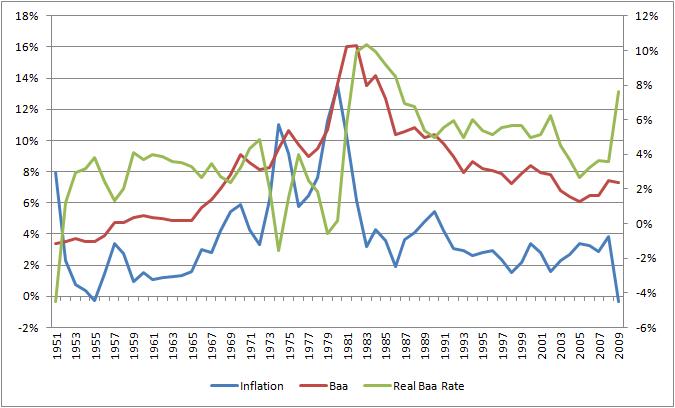
In looking at corporate bond rates (Moody's Baa index) and the S&P 500 since 1950, I think the reason for observing a positive relationship between changes in real interest rates and changes in the S&P 500 is mainly due to the underlying inverse relationship between real interest rates and inflation (which is inverse by definition because Real Baa Interest Rates = Baa Interest Rates - Inflation). In other words, decreasing inflation is associated with increasing real interest rates by definition. However, decreasing inflation tends to be associated with a rising S&P 500 as well.

Sunday, May 16, 2010

What I'm Reading

New Trading Systems and Methods

Model Portfolio Performance Update


The low beta aspects of the model portfolio have paid off during the last couple weeks' market downturn. Outperformance vs. the S&P 500 ETF (ticker: SPY) has widened to ~4.5%. In regard to our primary benchmark, outperformance vs. the Vanguard Total World Stock ETF (ticker: VT) has widened to ~12.0% as calculated by folioinvesting.com since the model portfolio was established 9/4/09.

Real Interest Rates


I started out this day mowing the lawn and thinking about a nice recent post at Crossingwallstreet.com that has to do with the outlook for gold prices and asserts that a main driver thereof is real interest rates (i.e. nominal interest rates minus inflation). Naturally, I wondered about the relationship (if any) between real interest rates and the stock market. My hypothesis was that an inverse relationship exists such that the stock market suffers when companies' cost of capital (real interest rate) increases. I'm interested in this potential relationship because I tend to think real interest rates will generally trend higher in the intermediate term as the Federal Reserve is forced to eventually confront inflation pressures by raising short-term rates / soaking up some of the base money supply. I'm not saying inflation pressures exist at present, I'm just inclined to think they are poised to increase over time as lenders and borrowers each become healthy enough to lend and borrow again, thus increasing the velocity of money (i.e. effective money supply).

As shown in the charts above, my hypothesis was not validated. If there is any relationship between real interest rates and stock market returns, it is positive. In other words, when real interest rates increase, the stock market tends to perform better (but the relationship is very tenuous with an R-squared of only about 7%). I think perhaps this is because the causation flows somewhat 'backwards'. When the stock market suffers, investors flock to treasuries for safety thereby driving down real interest rates. Perhaps the problem is how I'm effectively using treasury rates as a proxy for the changing 'cost of capital' for companies in the S&P 500. At a later date, I'll test the stock market returns against corporate bond rates (adjusted for inflation), rather than treasury rates, which is almost certainly a better proxy for changes in the companies' cost of capital.

In the meantime, since the value of treasury bonds tend to increase when the stock market declines, I'll have to give some thought and further analysis to potentially exchanging some stock exposure for exposure to short-term inflation protected treasury securities (TIPS) as a means of smoothing out the model portfolio returns. Or perhaps I'll save that move solely for those times I think the stock market is especially prone to a decline based on my favorite economic indicator, retail sales.
Quote for the Week: "There's nothing wrong with living on the first floor until you've spent time in the penthouse". - William Irvine, author of A Guide to the Good Life.

Sunday, May 9, 2010

model portfolio refinement 2


In a further effort to decrease correlation with the S&P 500, I've decided to allocate 1/3 of the model portfolio to foreign stocks with low betas. The new holdings will be 'acquired' tommorow via commission free trades and are shown in the chart above (32 stocks and 2 ETFs). Note: click the charts twice to enlarge them further for easier viewing.

The first ETF (ticker: DFJ) provides exposure to small cap stocks in Japan and its holdings are shown here. The beauty of a small cap focus is that it tends to exclude banks while still providing exposure to foreign stocks that don't trade in the U.S.

The second ETF (ticker EWM) provides exposure to Malaysia and its holdings are shown here. If you follow the link, you'll notice the Malaysia ETF is 31% financials, but I decided to let that slide because (i) it works out to only 1% of the model portfolio, (ii) it provides exposure to foreign stocks that don't trade in the U.S., and (iii) the ETF has a low beta (.74).

Separately, let me say a few more words about Exchange Traded Funds (ETFs). First, I think ETFs are superior to your typical mutual fund primarily because they tend to have lower annual fees. This is because ETFs are typically managed passively with low overhead (simply trying to mimic an index), whereas mutual funds are typically managed actively. Active management requires more overhead associated with hiring folks to research and trade securities. Since 90% of mutual funds don't keep up with stock indexes after accounting for overhead every year, I don't think the cost differential is worth it. So by default I think ETFs are better investment vehicles.

However, ETFs are still blunt instruments. For example, if you're like me and want exposure to foreign stocks but are averse to banks, oil companies, gold miners, and high beta, then there are hardly any ETFs out there for you. If your savings are in a brokerage account that charges a commission for every trade, then you can't finely tune your account because it would be cost prohibitive to buy and sell a large number of securities (unless your account is very large). However, if your brokerage account is at folioinvesting.com where there are no trading commissions, then you can afford to finely tune your investments as I've shown above.
Quote of the Week: "Always to seek to conquer myself rather than fortune, to change my desires rather than the established order, and generally to believe that nothing except our thoughts is wholly under our control, so that after we have done our best in external matters, what remains to be done is absolutely impossible, at least as far as we are concerned." - René Descartes (1596 - 1650)

Sunday, May 2, 2010

model portfolio refinement


I've decided to reduce the average Beta of the model portfolio. Although the model portfolio has been keeping ahead of our primary benchmark of Vanguard Total World Stock Index (ticker: VT), I'd prefer a little less correlation. Therefore, I've drastically cut down the number of stocks in the portfolio from 665 to 138 by selling all the higher beta stocks and redeploying the proceeds to the lowest beta stocks (all without incurring any trading commissions). My expectation is this reallocation will provide for less volatility going forward without any diminished returns in the long-run. However, in the short-run, if the S&P and/or VT spurt upwards, the model portfolio will most likely show some temporary underperformance, which is fine. Based on the stats shown in the chart above (calculated by folioinvesting.com), the Beta of our model portfolio is now 0.43 (relative to the S&P). Note, the Beta of the model portfolio was already 'low' at ~0.78 prior to these changes. Unfortunately, folio doesn't calculate the same stats relative to VT.

Quote for the Week: "I must die. If forthwith, I die; and if a little later, I will take lunch now, since the hour for lunch has come, and afterwards I will die at the appointed time". - Epictetus (AD 55 - AD 135) [In other words, it's counterproductive to worry about uncontrollable outcomes]

Sunday, April 25, 2010

good link

No post this weekend. Had to work a full day at my day job.

I did however follow a great link provided by Falkenblog. Has to do with low volatility stocks providing returns in line with overall equities (contradicting Modern Portfolio Theory), so that your return per unit of heartburn is maximized. Not only heartburn, but 'risk' insofar as (i) big drawdowns to your account have the potential to cause panic and lead you to sell at the worst possible time or (ii) you may have an unexpected use for that money you previously thought was 'long-term' and end up needing to sell at relatively low prices.

Quote for the Week: "He that cleaves to wealth had better cast it away than allow his heart to be poisoned by it: but he who does not cleave to wealth, and possessing riches, uses them rightly, will be a blessing unto his fellows." - Siddhartha Gautama Buddha (c. 563 BC - 483 BC).

Sunday, April 18, 2010

saving philosophy major; market timing minor

I won't be doing a full post this week with analysis since I was traveling for work all this past week and need to catch up on emails today and the chores corresponding thereto. What free time there was this weekend was spent indulging my new interest in backpacking, which entailed spending hours and untoward amounts of money at R.E.I. accumulating the gear I intend to use on at least a couple trips to the Shenandoah National Park this spring/summer. Funny how it's so easy to justify spending when it can be classified as an 'investment' that will produce years of enjoyment. Any remaining hesitancy can be easily obliterated by imagining future trips with my sons (the youngest of which is only 6 months of age). All I can hope is that by spending the money, I'll feel obligated to actually go out and put the gear to use (sort of like a gym membership initiation fee).

Separately, in regards to the 'market timing' posts of late, I should mention that these quantitative rule-based strategies aren't really market timing in the purest sense of the word, at least not to my way of thinking. I think pure market timing entails moving in and out of the market based on esoteric gut-level decision making. In other words, it's based on an intuitive synthesis of whatever quantitative and/or qualitative information happens to be available at the time and is therefore not conducive to testing against historical data. Alternatively, I see the rule-based strategies as data-driven decision making, which because they're systematic, are conducive to testing. Now, perhaps it's possible that someone has an ability to practice pure market timing, but even if so, there's no point in writing about it because the reader can never know whether or not the ability truly exists because it can't be verified by a test. Rather, any prudent reader would have to fall back to Occam's razor and assume the writer is full of BS and is simply trying to either enhance their own bank account balance or their social status.

Now, having provided the above disclaimer, I may from time to time write about a personal decision to enter or exit the market based on whether or not I think it's headed up or down. I'm not sure why I might do this, other than this blog might one day be read by my kids when I'm gone and it might be nice and/or helpful from them to read in relation to their own future investing endeavors. Or perhaps, having a written record of my trials and errors might help me refine a strategy quicker than I otherwise would. In any event, I'll try to practice my own market timing rarely and only then with thoughtful reasoning based on the three fundamental drivers of market prices, which are (i) long-term valuation metrics, (ii) intermediate-term economic growth, and (iii) short-term market sentiment. Still, there is no way of knowing ex-ante whether my decisions will do me more harm than good over the long run.

To a large extent, do to the huge uncertainty, market timing is an insignificant factor in long-term investing success. Much more important in accumulating a nest egg sizable enough to maintain one's standard of living throughout retirement is the discipline to save money, which in turn is a lot like diet and exercise. My friend across the street who is a financial advisor conveyed this analogy to me as follows: "What diet and exercise regimen is best? The one you can stick to." It doesn't matter if you follow Adkins, South beach, Weight Watchers, or Jenny Craig because it ultimately comes down to the simple fact of calories in and calories out. In terms of saving money, it ultimately comes down to finding some way of mastering your desires. You will never succeed in denying yourself something you want. Your only hope is to change what you want. Obviously, this is an ideal state of mind and, based on my expenditures this weekend, one I've yet to reach.

Quote for the Week: "Life's necessities are cheap and easily obtainable. Those who crave luxury typically have to spend considerable time and energy to attain it; those who eschew luxury can devote this same time and energy to other, more worthwhile undertakings." - Lucius Annaeus Seneca (c. 4 BC-AD 65), Roman Stoic philosopher.

Sunday, April 11, 2010

market timing (part 5.5)


I thought it worth elaborating on last week's post regarding rule-based trading according to moving-average momentum. In particular, if that strategy provides greatly reduced volatility with somewhat less reduced returns, then that begs the question of whether or not there is a way to generate only slightly reduced volatility with non-reduced returns? In other words, buy&hold levels of returns with less volatility than the buy&hold portfolio. [By the way, if I ever find a formula like this, or better yet, one with greater returns than the buy&hold portfolio and less volatility - I may try making a living off it before I disclose it in this space.]

As a straightforward non-creative attempt at providing an answer, I've tweaked last week's analysis as follows: rather than going to cash when the moving-averages are trending down, see what happens if you short the market at those times. The results of this test are shown in the chart above.

As expected, this strategy produces the same volatility as the buy&hold portfolio. The reason is because, every day, long or short the market, your portfolio will bounce around one way or another in proportion to how the market moves. Also expected, the Beta of this strategy is in the ballpark of zero. To understand the reason, simply imagine being long the market 50% of the time and short the market 50% of the time. When you're long, your Beta is 1.0; when you're short, your Beta is -1.0. Mathematically, 50%*1.0 + 50%*(-1.0) = 0.

However, the returns from this strategy don't beat the buy&hold portfolio. They don't even do well enough to provide a superior Alpha in comparison to last week's strategy of going to cash, rather than shorting the market. I can't really provide a full explanation for why this is, except to say two things: 1) transaction costs are doubled because not only do you have to buy and sell, you also have to sell and buy (to short), and 2) the market is very (although maybe not perfectly) efficient, which causes a high degree of randomness.

Overall, I have to conclude this buy&short strategy is inferior to last week's buy&sell strategy because you have higher volatility and (slightly) lower returns.
Side note: check out 'Black Monday' (and the days following in Oct-'87) in the chart above. Wow.

Technical Notes:

1. One reader commented last week that the 6% returns for the buy&hold portfolio looked low. In other words, everyone tends to think stocks provide 10% returns in the long run. A few reasons for the discrepancy: first, the returns shown in each decade are geometric, rather than a straight average of the ten years; second, the returns in each decade exclude the results of the first 200 days in order to first calculate a 200-day moving-average prior to beginning the analysis; third, these returns are for the Dow Jones Industrial Average (historical dividend adjusted pricing provided by yahoo finance), which may vary from what an outfit like Ibbotsson may deem to be the 'stock market'.
2. It's interesting how the Beta can be near zero and yet the trading portfolio appears to somewhat follow the buy&hold portfolio when viewed on a 10-year chart. This is something to keep in mind when considering any statistic that's calculated based short term data (e.g. daily). Many paradoxes in finance (life?) can be resolved by rigorous attention to the time frame under discussion. In many cases, the small deviations from the short-term statistic (be it Beta, an average, or whatever) accumulate in one direction over the long-term. For instance, people like to point out that when the U.S. market declines, foreign stocks tend to decline as well, thereby nullifying the diversification benefit. However, when they say this, they are mainly thinking in terms of the short-run (i.e. days), when the diversification benefit is a actually a long-term phenomenon. Foreign stocks are less correlated with U.S. stocks in the long run mainly due to long run factors like demographics, political regimes, etc.
Quote of the Week: "Not needing wealth is more valuable than wealth itself." - Epictetus (AD 55–AD 135) Greek Stoic Philosopher.

Saturday, April 3, 2010

market timing (part 5)


This week I decided to test a slightly different momentum strategy as follows:

1. If the price exceeds both the 50-day moving average ("MA") price and the 200-day MA price, then buy.
2. If the price is less than both the 50-day MA price and the 200-day MA price, then sell.
3. Otherwise, hold (e.g. price exceeds 50-day MA, but is less than the 200-day MA).

Same as last week, I tested this strategy against Dow Jones Index prices going back to 1930. For each decade, I waited 200 days (in order to calculate a 200-day MA) and then bought into the market. From there, all buy/sell decisions were driven by the aforementioned rules.

The chart above illustrates the results. Again the trading portfolio was less volatile than the buy&hold portfolio. Again, the average Alpha was approximately 2% (annualized). Again, the strategy performed well during the 1930s, when you would have needed it the most.

However, this strategy produced a more consistent Alpha, the standard deviation of which was only 3%, so the average Alpha of 2.3% divided by the standard deviation of roughly 3.0% was about 0.76. Although I still can't say this is statistically significant, it's better than the 0.53 result from last week's trading strategy.

The only decade in which this strategy didn't work well was the 1990s, when pretty much everything simply marched upward. And in my opinion, not doing as well as the overall market in the good times, isn't as awful as doing worse than the overall market in the bad times.

If you study the chart in detail, take note of the 2000s. What's interesting here is although the Alpha was technically 0%, that's basically just a quirk of both the Trading Portfolio and the Buy&Hold Portfolio having produced 0% returns. You'll notice the standard deviation of the Trading Portfolio's annual returns during this decade was only 11%, which is much less stomach churning than the Buy&Hold Portfolio's 25%. In my book, having the same returns (even 0%) with much less volatility is a win. Think about if you lost a job with corresponding health insurance and faced some unexpected medical bills - all of a sudden, that savings you thought wouldn't be needed for at least 10 years is the subject of urgent demand. Would you rather face the prospect of pulling your money out of a Buy&Hold Portfolio or the more stable Trading Portfolio?

Quote for the Week: As in nature, emotions abhor a vacuum. If we progress in vanquishing negative emotions such as wishing for certain things to be different and instead spend more time enjoying certain other things as they are, then we will find we are experiencing a degree of tranquility that our life previously lacked. We will then naturally become more susceptible to joy. - Paraphrasing of "A Guide to the Good Life: The Ancient Art of Stoic Joy", page 123.

Sunday, March 28, 2010

market timing (part 4)


As contemplated last week, I've tested our optimized trailing stop-loss and trailing go-purchase parameters against some out-of-sample data to evaluate if this strategy has any relevance or if the positive results using S&P data from the 2000s is simply a quirk of randomness. The chart above conveys the results using Dow Jones Index data from 1930-2000.

Again, as with most strategies that entail being out of the market some portion of time, the volatility of the trading portfolio is less than that of the buy&hold portfolio. As is typical, this lower volatility is accompanied by lower returns. To determine if the returns are sufficient given the reduced volatility, we scale down the buy&hold returns according to the lower Beta of the trading portfolio. Then we compare these 'adjusted' buy&hold returns to the trading portfolio returns, to see if the trading strategy added any excess return or 'Alpha'.

In short, I think the results are minimal / inconclusive. You can see the average Alpha of the trading strategy over the decades is roughly 2% per year, which although nothing to sneeze at, is a small amount when compared to the approximately 4% standard deviation of that same Alpha . In other words, the Alpha doesn't appear highly statistically significant and one could reasonably conclude the Alpha is actually 0% and the obtained result of 2% is simply a fluke.

However, I still found this to be a worthwhile / interesting exercise. For one, I think investors should always position themselves to withstand the worst (i.e. don't bet more than you can afford to lose). In this case, although worse fates can always occur, the 1930s were a tough time by any standard. Imagine nearing or having just entered retirement and then realizing a negative 5% annualized return over the next decade. Talk about something that will force a re-prioritization of your life. In this context, I think it noteworthy how well the more conservative trading strategy of trailing stop-losses and trailing go-purchases outperformed the riskier buy&hold strategy. I mean, if a strategy is going to come through for you with flying colors when you need it the most, then it warrants some consideration regardless of its average performance. This brings to mind some words of wisdom often quoted by a friend and financial advisor who when mentioning the inadequacies of averages, says something to the effect of, "The average depth of Lake Michigan is only four feet, but I wouldn't want to walk across it".

Quote for the Week: "The more pleasures a man captures, the more masters he will have to serve." - Lucius Annaeus Seneca (c. 4 BC-AD 65), Roman Stoic philosopher.

Sunday, March 21, 2010

market timing (part 3)


Market timing rules that rely on quantitative data (stock prices, economic data, etc) to generate a buy/sell decision can generally be classified as momentum strategies or reversion to the mean strategies. The premise of momentum strategies is essentially that whatever is increasing will build on itself in some fashion and continue going up (at least in the short-term). One of the simplest momentum trading rules is a stop-loss, whereby if the price of the stock drops below a certain level, the rule is to sell it at that point rather than continue riding it down. By the same token, one can create a rule whereby if the price of the stock increases above a certain level, the stock is purchased at that point in hopes of riding it upward.

The Test
To test the efficacy of this sort of strategy, I set up a back-test using historical price data for SPY, which is a stock that tracks the S&P 500 index. The rules I used were:

1. If the price of SPY drops to a level that is eight standard deviations (calculated on a daily basis) lower than its most recent highest price, then a stop-loss is triggered and the stock is sold.

2. Then, if the price of SPY increases to a level that is seven standard deviations higher than its most recent lowest price, a 'go-purchase' order is triggered and the stock is bought.

Results
The results of this test are shown in the charts above. Just as with the timing strategy based on retail sales data (a couple posts below), this strategy entails being out of the market a substantial amount of time (37% of the time in this case), which causes the trading portfolio value to be less volatile than the buy&hold portfolio value. As a result, the Beta of the trading portfolio is only 0.3 as calculated against the buy&hold portfolio. However, the return of the trading portfolio is 2.9% (annualized) vs. -3.4% for the buy&hold portfolio, which implies a trading portfolio Alpha of 4.0%.

Next Steps
You may wonder how I came up with the parameters for the test (eight standard deviations, etc). The answer is that I optimized the parameters to provide for the maximum Alpha based on this data set. The resulting Alpha for differing stop-loss and go-purchase rules are shown above in the sensitivity chart. Next week, I'll run this test again using price data from the past year to see how our optimized parameters perform against out of sample data. If the stock prices are truly random, it's not likely that our optimized parameters will result in any meaningful Alpha (but we'll see). I'll also run this test against price data for a different stock as another way to see if our results are at all robust.

Technical Notes
1. The test includes transaction costs of 0.20% for each trade.
2. The trading portfolio earns 0% interest during those times it holds all cash.
Quote for the Week: "No man is crushed by misfortune unless he has first been deceived by prosperity." - Lucius Annaeus Seneca (c. 4 BC-AD 65), Roman Stoic philosopher.