"Act so as to keep the mind clear, its judgment trustworthy" - Dickson G. Watts, author of Speculation As A Fine Art And Thoughts On Life. [A brief summary here (link)]

Saturday, November 27, 2010

value investing


I've been listening to the siren song of the value investing philosophy lately. It started with attending a lunch sponsored by the local CFA chapter where the speaker was Pat Dorsey from Morningstar. Then I bought his book and read it. Now I've signed up for the premium membership tools (stock screeners, research reports, etc) over at morningstar.com.

Sometimes I wonder if the main near-term benefit of writing this blog and managing a model portfolio is that it absorbs my free time devoted to the investing hobby such that I end up leaving my own portfolio alone without a bunch of excessive trading.

Anyhow, I wondered whether or not low beta stocks may provide superior returns in part because they overlap with morningstar's notion of economic moats. In short, there seems to be a little connection, but it's not overwhelming. In the chart above, you can see how the 169 stocks in the model portfolio are rated by morningstar in terms of having economic moats (not all 169 stocks are covered). It appears as though the wide moat stocks do indeed exhibit less volatility as measured by standard deviation of returns (beta isn't yet available as a field to screen). Also, it appears the wide moat stocks in the model portfolio are considered by morningstar to trade at a discount to their assessment of fair value. However, this could potentially be caused by morningstar calculating higher fair values for stocks they deem to have wide moats.

At the risk of being rash, I decided to go ahead and tweak the model portfolio just a bit to provide a slight value tilt. I sold nine stocks with no or narrow moats that were deemed to be overvalued 1.5x or more and I bought nine stocks with wide moats that were deemed to be 0.86x or less of fair value (which puts them in top quartile of morningstar's database).

Sales: CHD, EW, BJ, ORLY, ILMN, INFA, PNY, RYAAY, LFL
Purchases: EXC, GE, MDT, NVS, RHHBY, ZMH, WU, AMAT, CSCO

Saturday, October 30, 2010

esoteric rambling hand waver (yours truly)


I'm on the verge of transitioning the model portfolio back to being net long stocks for two somewhat related reasons. Most importantly, when adjusting for last year's cash-for-clunkers program (i.e. excluding auto sales), retail sales growth seems to have stabilized with a slight up trend.

Secondly, I just think the forces of inflation will eventually overwhelm deflation. I know there is plenty of slack in the labor market right now which is generally where higher inflation expectations originate, but the problem is that much of this slack is comprised of folks tied to the housing/finance industry who don't have the skills to immediately switch to more productive sectors of the economy. So I think in those more productive sectors, we actually could see some wage inflation. Meanwhile, in housing/finance, the blood has been let and folks left with jobs probably won't see a steady drop in their nominal incomes.

Then of course you have the 'currency wars' whereby sovereign states with inverted age demographic pyramids (e.g. Japan, E.U.) or even just age columns (e.g. U.S.) are pursuing Quantitative Easing in order to monetize their high levels of external debt. Of course the party line is they are only trying to ward off deflation, but call me cynical, I don't think the general public has the stomach for another Paul Volker to come in and disinflate when banks start lending again (which they are now by the way) thereby increasing credit, which I believe is the largest driver of the total money supply.

So who wins with inflation in the long run? If you have a mortgage loan or large amount of other debt, you might break even because that gets repaid with less valuable dollars, but you still have to cope with higher costs throughout the rest of your budget (food, energy, consumer goods, healthcare). Who loses with inflation? Anyone without a mortgage, especially retirees who are trying to live off their savings. Ultimately, if it really gets out of hand and transitions to hyperinflation, everyone loses because exchanging goods and services for currency could become undesirable, which is the basis for the specialization of labor that underlies modern society. I realize that last point could qualify for tin-foil hat club membership, but I do believe most things sound crazy until they don't.

As an aside, I suspect the reason bonds and stocks have rallied together of late is due to the strong bid from the FED underlying bond prices. As institutions understandably sell treasuries at incredibly low yields to the FED, they redeploy the proceeds into riskier assets like corporate bonds. The sellers of the corporate bonds redeploy their proceeds into preferred equity and the sellers of preferred equity redeploy into common equity. Thus, the FED can increase asset prices across the entire risk spectrum. Now there is a seller for every buyer in each of these asset classes, but as the prices get bid up, you have more companies raising capital via bond issuances or stock offerings. If the companies invest that money to create new productive assets (machines, software, etc), then it will drive economic growth, at least in nominal terms before adjusting for inflation. In real terms, since the world's population growth is declining, we don't need as much real growth in production of goods and services. But of course real growth would still be desirable insofar as it would necessarily increase material wealth per capita. I think that is a good thing for everyone out there making less than say ~$70m per year, but above that level, I subscribe to the view that material wealth doesn't correlate with happiness.

So, back to where I started, the only question is when I increase exposure to stocks and how much. I've been thinking there would be a pull-back coming this week on news of Republican gains in congress and the putative quantitative easing announcement. You know, the old "buy the rumor, sell the news" bit. Unfortunately, that seems to be a popular bit of advice, so if there are enough market participants out there of this persuasion, we may actually see the market rise again this week.

Conclusion: I'm going to sell the 1/3 allocation to the ETF that moves inversely with the S&P on Monday and sit with the proceeds in cash until next week when I may redeploy the cash into the low beta stock holdings.

Wednesday, October 27, 2010

time to short Yen?


According to this persuasive article, it may be time to short Yen, which can be done by purchasing the Exchange Traded Fund that moves 2x the inverse of the Yen; ticker YCS.

Sunday, October 10, 2010

model portfolio 10/10/10


Although I decided to go 'market neutral' back in June based on weakened retail sales data, the instrument I used to hedge the stock exposure is the ETF that is short the S&P 500 (ticker: SH). Since the model portfolio's long positions are roughly 1/3 foreign stocks, I essentially hedged out the stock exposure while leaving some foreign currency exposure. Sometimes, it's better to be lucky than good (in the short run). So while the market has been fairly volatile and the model portfolio has been fairly stable (providing for a superior risk-adjusted profile), the model portfolio has only maintained its return lead over the indexes due to the declining dollar alluded to above.

real estate (part 4)


I wondered what it might look like if one were to trade the top-25 cities based on momentum. Again this is based on OFHEO data, which pertains to single-family residential.

The Test:
1. Rank the 25 cities based on price appreciation over the prior three quarters.
2. Invest 10% of the portfolio into each of the top-10 ranked cities.
3. Whenever a city falls out of the top-10, sell the investment (with 6% transaction cost) and buy whatever city has moved up to the top-10. These trades are modeled using a two-quarter lag, so as not to incorporate any hindsight bias. Two quarters is probably the minimum amount of time necessary to receive the price appreciation data from the government pertaining to the prior quarter and then make the trades.

Results:
1. With transaction costs, the momentum trading strategy results pretty much match the results achieved by simply buying and holding all 25 cities. The benchmark of buying and holding all 25 cities is without any re-balancing and the associated transaction costs.
2. Without transaction costs, the momentum trading strategy is far superior, generating much higher returns with approximately the same volatility.

Conclusion:
As with many quantitative strategies, transaction costs become the limiting factor. However, the insight is useful if one is deploying new money and would have to incur the transaction costs in any event.

One day I'd like to see how closely the OFHEO data tracks the appreciation of apartment properties and other commercial property types. Since those larger transaction sizes typically have much lower transaction costs (say 1.5%), I'd like to see if this would be a viable investment strategy, or at least a helpful augmentation.

Thursday, October 7, 2010

great minds

think alike as crossingwallstreet makes the same point articulated in this space not two weeks ago.

Saturday, September 25, 2010

making money in a random market (part 2)


It occurred to me that i should know what the returns and volatility are if one simply holds SPY overnight, every night - regardless of whether or not the market was up intra-day. Interestingly enough, it appears that the positive attributes of the aforementioned strategy whereby one holds overnight when the market was up that day are unrelated to whether or not the market was up that day. In fact, if one simply holds the SPY overnight (every night), then the average daily return is .036%, whereas if one only holds overnight after the market was up intra-day, then the average daily return is only .030%. Furthermore, simply holding overnight, every night, provides for an overall return since 1993 in line with a buy-and-hold strategy with much less volatility.

If I were to fabricate a theory to explain this phenomenon, I'd say it has to do with a liquidity premium related to the idea that many market players (e.g. day traders) are only active during the day and liquidate their positions prior to the market close so as not to have exposure over night. So the strategy of only holding stocks overnight means that one is selling at the open (when others are bidding up the prices) and buying at the close (when others are selling down the prices).

If one wanted an apples-to-apples comparison of the hold-overnight strategy against the buy-and-hold strategy, then one could leverage their investment overnight (via margin borrowing). This means one would be holding more stock in comparison to the amount of their investment and therefore the changing price of that stock in proportion to their investment would be more volatile. Given the data set I'm working with here (i.e. ticker SPY since 1993), if one were to have consistently financed 47.9% of their overnight holdings via margin, then the annualized volatility (standard deviation of returns) would have been 19.8%, precisely the same as for the buy-and-hold strategy. However, the returns from this leveraged hold-overnight strategy would have been 12.88% (annualized), which compares favorably to the 7.33% annualized return provided by the buy-and-hold strategy. For this analysis, I've just assumed the interest rate associated with the margin borrowing was a constant 10%.

Aside from higher returns with equivalent volatility (if leveraged) or equivalent returns with lower volatility (if unleveraged), there is the conceptual risk reduction associated with the fact that one would only be exposed to stock price fluctuations for ~16 hours per day, rather than 24 hours per day. So if something bad happens in the world that triggers a market crash, one would theoretically have a 1 in 3 shot at side stepping the carnage to their portfolio.

So what's the catch? Transaction costs. If one bought everyday at the market close and sold the next morning at the market open, one would lose their entire investment over time to brokerage commissions. This is the case even if one started with $100, 000 and could complete trades for only $10 per 1,000 shares traded.

Nonetheless, this overnight holding phenomenon could be marginally useful information even if one has to incur transaction costs, because if one is using some other system that generates daily trade decisions, one could enter those buy orders at the market close and enter those sell orders at the market open and perhaps realize some additional return over time.

Saturday, September 18, 2010

making money in a random market


i was googling for articles on suggested ways to make money in a random market and i came across an interesting site that articulates the theory of the screw, which is a belief i myself hold and recommend this article to you as worthwhile reading. but aside from that, the author writes in another article about momentum investing. Soooo, i decided to do a simple backtest on the system whereby one buys and holds overnight if the market closed that day higher than it opened. For the test, i pulled historical quotes for the ETF that tracks the S&P500 (ticker: SPY), which has been trading since 2/1993.

what i found is an annualized return of 3.59% with annualized standard deviation of 7.36% over this 17.6-year time period. now, this isn't very compelling if you consider one could obtain an annualized return of 3.50% with annualized standard deviation of only 0.57% over that period by holding 3-mo. t-bills. however, if the stock market would have performed better over that period, this system would have undoubtedly performed better, whereas the same upside potential doesn't exist with t-bills. so perhaps the correct benchmark is the s&p500 itself, which provided a return of 5.36% (annualized) with standard deviation of 15.26% (annualized) over that 17.6-year time period. so for this trading system, the return/volatility was 0.49, which compares favorably to the return/volatility provided by the s&p of 0.35.

now to get a truer picture, i'll have to go back later and model in transaction costs, but the purpose of this test was simply to get a feel for whether or not this system even has any potential. i may have to test this system a bit more, but at first blush, it doesn't appear half bad. i mean look at the chart above since 2001; sure it hasn't made any money, but compare that to the crazy volatility and low returns of the s&p 500.


Technical Notes:
1. if you want to buy and hold overnight, you must buy prior to the close (unless you buy in the after-market), but i'm just assuming one can buy a few minutes prior to the close and almost always hit a bid very close to the closing price assuming there are no huge moves during the last few minutes.

2. i did not take the time to model in transaction costs, which would dilute the returns of this system.

Sunday, September 12, 2010

no free lunch here


I was wondering if folks who ordinarily have some portion of their portfolio allocated to bonds might be better off to instead utilize a mix of stocks and cash. The idea is the stocks and cash would be proportioned so as to achieve the same volatility as bonds while potentially achieving a higher return.

To investigate, I pulled historical data from yahoo! finance going back to the early 1960s for 3-month treasury bills (proxy for cash returns), 10-year treasury notes (proxy for bond returns), and the S&P 500 (proxy for stock returns). Then I solved for the stock/cash proportions (54.7% / 45.3% with monthly rebalancing) that would provide for the same volatility (8.3% annualized standard deviation in returns) provided by the 10-year treasury notes.

What I found is that the stock/cash portfolio provides a slightly lower return than the 10-year treasury notes. Perhaps next week I'll try to get my hands on some corporate bond data and see if the idea pans out better there.

congrats to jmu dukes

Money Quote: "It was the first time Virginia Tech Coach Frank Beamer has lost to a division I-AA opponent since taking over the program in 1987. It also was only the second time a division I-AA team defeated a ranked division I-A team, the first being when Appalachian State shocked No. 5 Michigan in 2007." Full story here.

Also, intriguing bit of motivation here: "Asked during the week about Saturday' s matchup with No. 13, Virginia Tech, Matthews [JMU coach] had a simple summation for his team's chances against a major-college, in-state school located a couple of hours south off I-81 from his Harrisonburg campus:

"When you get right down to it, they didn't want any of our guys. It's kind of comical to think you're going to go down there and beat them."

Thursday, September 9, 2010

Saturday, September 4, 2010

model portfolio (1-year in)


Between reading loan documents for work and preparing for my fantasy football draft on Monday, I won't be doing a real post this weekend. However, the charts above show the model portfolio performance after the completion of one full year of history.

As a recap, from 9/2009 thru 4/2010, the model portfolio slowly but steadily got out to a lead over the benchmarks, in my opinion due mainly to the low beta stock selection, economic sector diversification, and minimization of financial sector exposure. From 4/2010 thru 6/2010 I pruned the portfolio to lower the beta even more and allocated 1/3 to low beta foreign stocks in an effort to further lower the covariance with the S&P 500. In 6/2010, I turned bearish based on the weakening economic fundamentals, mainly retail sales, and allocated 1/3 of the portfolio to the ETF that moves inversely to the S&P 500 (ticker: SH). Since then, the portfolio volatility has been very low while the equity markets as a whole have essentially been unchanged from then to now, but with a lot more volatility along the way.

Overall, I am pleased with the results, while realizing this could well be 100% luck. The markets are so volatile in comparison to the magnitude of the model portfolio outperformance, that one could reasonably attribute this outperformance to statistical noise. As I told my son last month while explaining the basics of investing to him, one should try to select an advisor that can demonstrate this type of outperformance consistently over say 10 years. Further, even such a track record of outperforming 9 of 10 years would be insufficient if the one year of underperformance is so awful as to make the cumulative return lag the market benchmark. Still, if an advisor is found who can truly meet this standard, it could still be luck, but intuitively I believe such a track record would provide for a better chance of outperformance in coming years as compared to an advisor without such a record.

Otherwise, if one can only find advisors for whom the prospect of outperformance is essentially a gamble, why not save the management expense and gamble on your own? I don't mean go crazy and put 100% of your savings into the latest hot stock, but I do think most folks would do well to (i) minimize their management expenses via a low cost platform like folioinvesting.com and (ii) minimize portfolio volatility via sector diversification, geographic diversification, and low beta stock selection. For the technically inclined, disciplined market timing strategies based on quantitative rules can help minimize portfolio volatility as well.

Saturday, August 28, 2010

Inflation Expectations Bet


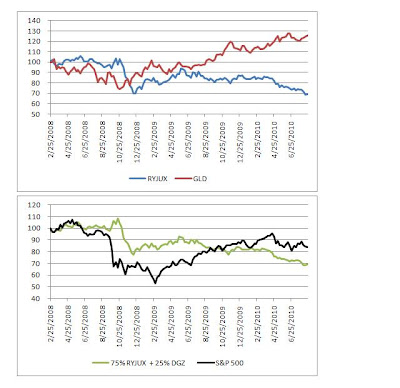
I was thinking about the disconnect between gold prices and government bond prices as they pertain to inflation expectations. Gold prices are high presumably due to expectations of increased inflation. However, government bond prices are high (i.e. interest rates are low) presumably due to expectations of low inflation if not outright deflation. The first chart above illustrates this disconnect as represented by the ETF that tracks the inverse of the 30-year Treasury bond (ticker: RYJUX) and the ETF that tracks gold prices (ticker: GLD). As you can see, the spread between the two is relatively wide now. In the simplest terms, if I want to try profiting from this disconnect, I might consider (i) buying the ETF that moves inversely to the price of gold (ticker: DGZ) and (ii) buying RYJUX.

Such a combination would reflect my personal expectation that inflation reality will play out somewhere in between the two aforementioned sets of expectations. Helicopter Ben Bernanke will neuter deflation by increasing the base money supply via quantitative easing, thereby sufficiently offsetting the decline in credit / velocity of money. The resulting increased inflation (or lack of deflation) will raise nominal interest rates, thereby decreasing bond prices and increasing the price of RYJUX. However, since inflation probably will not get out of hand and I think this outlook will eventually become widespread, it will cause the price of gold to decline, thereby increasing the price of DGZ. If I'm wrong and inflation gets out of hand, then losses from DGZ should be more than offset by gains from RYJUX.

So there are three scenarios:
1. If there is moderate inflation (my expectation), then this trading setup should do well.
2. If there is hyperinflation, this trading setup should do just OK.
3. If there is deflation, this setup is most likely a looser.

I might consider solely buying RYJUX, but then it's possible that increased inflation expectations could be offset by lower real interest rates, thus leaving nominal interest rates unchanged, thus leaving the price of RYJUX unchanged. Meanwhile I would miss out on the likely rise in DGZ resulting from the moderate (not hyper) inflation.

UPDATE: The fly in the ointment here could be the method of quantitative easing. For instance, if the Fed keeps the treasury bond prices artificially high by purchasing them with newly created money, then you could in fact end up with the counterintuitive scenario of continued low interest rates on treasury bonds and high inflation, in which case the trade outlined above would be a bust until the quantitative easing abates. In other words, the Fed could seriously distort the connections between market expectations of inflation and treasury interest rates. However, the Fed could implement quantitative easing by purchasing financial assets other than treasuries, such as mortgage bonds, in which case the trade would likely work out well.

Technical notes:
1. The charts only go back to the start of 2008 because that's when the DGZ ETF was originated.
2. The allocations between RYJUX and DGZ are 75% and 25%, respectively, because DGZ is more volatile and those proportions help minimize the overall volatility of the setup.
3. To be precise, 30-year government bond prices may be high primarily due to technical factors such as 'flight to safety', rather than expectations of low inflation or deflation and the associated low short-term interest rates during the foreseeable future, but the distinction shouldn't impact the above analysis.

Quote for the Week: "Envy reflects our values by showing us not just what we want, but also what we would do to get what we want...because we're envious only of people who make their money in ways that we condone. We envy people for getting what we want in ways we can imagine. The more distant the possibility of achieving a certain kind of success, the weaker the envy. How can you control your envy? The same way you control all your emotions: by changing your beliefs. Convince yourself...that your life will not be essentially improved by a new patio, and you'll no longer envy your neighbor's new addition to his house. When you change your values, you change your emotions...success depends in part on understanding how our evaluations direct our emotions. To gain that understanding, we need to do a bit of philosophical analysis. -Joshua Halberstam, author of Everyday Ethics, copyright 1993.

Saturday, August 21, 2010

model portfolio backtest


One of the cool things about folioinvesting.com is the ability to quickly see a backtest of how your current portfolio would have done in the past versus a benchmark. As shown in the chart above, our model portfolio with roughly 2/3 invested in low beta stocks and 1/3 invested in the short-S&P 500 ETF (ticker: SH) would have done pretty well over the past 4 years as compared to being 100% long the S&P 500.

Note: the time period selected (i.e. 4 years) was chosen solely because the short-S&P ETF wasn't originated until 6/2006.

real estate (part 3)


So what happens if I just select the 10 cities with the lowest volatilities and allocate 10% to each one without any regard to the correlations amongst the cities?

Answer: since the volatilities are less ephemeral than the correlations, this is a good solution. Maybe not perfect and I know there are more sophisticated methods available, but for someone like me with limited mathematical abilities this is a good practical alternative. As shown in the chart above, the cities with the lowest volatilities in the first 10 years tend to maintain these characteristics during the subsequent out-of-sample test.

For the sake of comparison, the average volatility of the 10 selected cities during the first 10 years was 2.8%, which is lower than the average volatility of the 25 cities of 4.2% during that period. During the subsequent out-of-sample test, the realized volatility of the 10 selected cities remained only 2.8% while the volatility of the 25-city portfolio actually increased to 4.6%.

Take-away: to minimize volatility, just allocate amongst the least volatile constituents.

Big Take-away: Be sure to conduct an out-of-sample test, so you don't get fooled by randomness when trying to answer a question based on historical data.

Quote for the Week: "The return of your investment is never the direct payoff of any one thing, but from the self-knowledge and connections gained by getting one's hands dirty. Much of success is dreaming about finding gold, and then discovering you can get rich selling shovels to gold miners. There are many examples of businesses founded on unique business selling points that, with hindsight, were wrong. This is the one thing ignorant but ambitious young people have that their more knowledgeable and older colleagues are envious of. Young people have the time an energy to discover [what] older people do not, but this assumes one actually invests this time and energy doing things, and does not just talk about them. In searching for alpha, you often have dreams that are often ill-founded, but they can actually be beneficial, because they offset the general under-appreciation of the option value of trying things and then learning an incidental skill that introduces you to new opportunities." -Eric Falkenstein, author of Finding Alpha

real estate (part 2)


So to pick up where we left off: how can one easily and reliably minimize volatility? The first chart above shows what happens when you weight the cities according to what would have produced the lowest volatility in the first 10 years and then watch what happens in the subsequent 10 years.

Answer: in the out-of-sample test, the formerly low volatility portfolio unexpectedly becomes even more volatile than the equal weighted portfolio.

Explanation: the portfolio weights were chosen via Excel Solver to minimize volatility during the first 10 years. This approach implicitly accounts for not only the volatility of each city, but the correlations amongst the cities. Sounds great, right, more is better? Not when the correlations are random. What happens, is the cities that were formerly non-correlated by chance are subsequently correlated in the out-of-sample test. Classic case of fitting the data to a theory or being fooled by randomness.

Just as aside, the weighted average volatility of the constituent cities selected by Solver was 4.4% during the first 10 years. This weighted average volatility was even higher than the 4.2% volatility of the equal weighted portfolio of cities, but nonetheless the selected portfolio exhibited an actual overall volatility of only 1.0% during the first 10 years because of how the movements of certain cities just so happened to offset the movements of other cities. When I subsequently conduct the out-of-sample test, the "just so happens" didn't happen anymore. Next I'll show a simple way to overcome the problem of persnickety correlations.

Saturday, August 14, 2010

retail sales update


Just a quick update on yesterday's release of US retail sales data. Looks like the year-over-year weakening may be stabilizing, but I think I'll wait for an outright uptick before moving the model portfolio back to a net long position. The market neutral position over the past couple months has helped widen the gap to 11% over the benchmark (Vanguard Total World Stock ETF).

real estate


Following in the wake of my friend Peter Benda's research of various housing markets around the country, I decided to download some data from the government (OFHEO) and do some simple exploration myself. As you may recall, I've been contemplative this year of the lack of connection between risk and return as shown in the book Finding Alpha. Well, I thought it may be interesting to follow that train of thought into the real estate sector where I happen to have a personal interest due to my line of work.

To that end, I took a look at whether or not there is a statistical connection between risk (as measured by volatility) and return (price appreciation) as it pertains to housing prices within the top-25 metro areas in the US. As you can see in the scatter chart above, where each dot represents a different city's position on the risk/return plane, there is no apparent connection (click each chart twice to view clearly).

I think the take away is that investors should try to minimize risk as much as possible. If the future looks anything like the past, this strategy ought to result in average returns with below-average volatility. Of course, the next logical question is how one should minimize risk. One possibility would be to allocate an equal weighting of one's investment portfolio to each market, which I think should be the null hypothesis. Another possibility would be to allocate market weights according to what would have minimized volatility within the past say 10 years, but this approach assumes that the standard deviations and correlations of and between market returns will persist into the future. Next week we'll see if this is the case.

Quote for the Week: "My third maxim was to endeavor always to conquer myself rather than fortune, and to change my desires rather than the order of the world, and in general to habituate myself in the belief that save our thoughts there is nothing completely in our power, and so to recognize, in respect of the things which are external to us, that when we have done our best, whatever is still lacking to us is, so far as we are concerned, absolutely impossible of achievement. This, it seemed to me, is sufficient to prevent me from desiring for the future anything which I knew myself incapable of having, and so to render me content. For since our will does not of itself lead us to desire anything save what our understanding exhibits as being in some fashion possible of attainment, it is evident that if we consider external goods as being all alike beyond our power, we shall no more regret the absence of goods that seem due to our station, should we through no fault of our own be deprived of them, than we do in not possessing the kingdom of China or Mexico. Making thus, so to speak, a virtue of necessity, we shall no more desire health when ill, or freedom when in prison, than we now do bodies made of a matter as little corruptible as diamonds, or to have wings to fly like birds. There is, however, I confess, need of a prolonged discipline, and of meditation frequently renewed, if we are to hold firmly to this attitude in all circumstances..." - Rene Descartes (1596-1650)

Tuesday, August 3, 2010

vacation


i've been neglecting my commitment to weekly posts because i was on vacation this past week in searsport, maine where my wife has family. couldn't have asked for better weather - sunny everyday and mid-70s temp. only drawback was i threw out my shoulder either golfing, skipping rocks, or tugging on the dogs' leashes - take your pick. was ok though b/c i didn't look at the blackberry and successfully checked out mentally from the office. fresh lobster (1.5 lb, hardshell) from young's lobster pound didn't hurt either. most important, family time was a treat.

i succeeded just prior to the trip in sparking my 15-year-old's interest in philosophy (to add to our shared interests) and we basically went wild buying a bunch of books on the subject at the various independent bookstores. everything from text books published in 1901 to modern library edition classics from the 1950s to re-interpretations published this century. what this means is i now have fresh quotes to pass along to you dear reader.

Quote for the week: "How singular a thing is pleasure and how curiously related to pain, which might be thought to be the opposite of it; for they never come to a man together, and yet he who pursues either of them is generally compelled to take the other." - Socrates, presumably speaking of my shoulder or market volatility, i'm not sure which.

Monday, July 19, 2010

new ETFs on the way

This is a step in the right direction since heretofore if you wanted to invest in an international stock ETF, you most often had to accept econonic sector exposure corresponding to the economy of the country or continent in question. Now, these ETFs allow you a bit of fine tuning of economic sectors, but less choice with respect to specific countries. Also, from just peeking at the top ten holdings of the ETF for Consumer Staples ex US, it appears that most of the exposure is related to large cap companies, the stocks for which one could purchase individually now on the US exchanges. In other words, it's not like the Malaysia ETF held in our model portfolio that provides access to a bunch of stocks you just can't buy here.